Using InfoWorks Live Pro (IWLive Pro) HydroCo have developed a process to assess if a suite of models are fit for purpose.
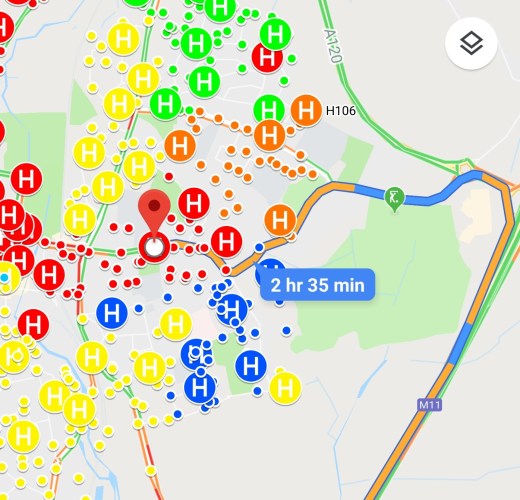
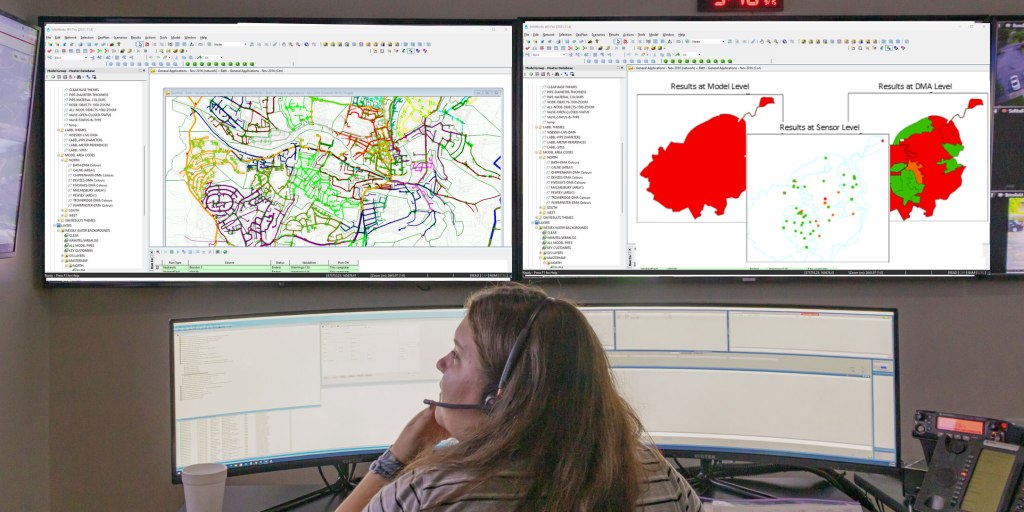
By linking the telemetry system to the model in IWLive Pro, real time comparison is possible between the model and telemetry. The software shows a visual representation of how well the model and telemetry data correlate or deviate from reality (e.g. due to network alterations or increased headlosses) using customisable Red, Amber and Green warning bands. Erroneous data can also be filtered out by IWLive Pro, ensuring only good data is considered.
Digital Twin

Real-Time Data
Model Maintenance Indictor
Demand Scaling
An SQL server (or other data lake sources) links the telemetry system to IWLive Pro enabling thousands of live data feeds to easily be allocated to the model (using SQLs and GIS).
Demand within the model can also be updated to reflect a variety of demand scenarios such as peak summer demand and average demands, by demand scaling or using Demand Watch. Modelled large consumers can also be dynamically linked to the telemetry to ensure the flow is modelled as recorded.

Linking Telemetry to Models

Validation Metrics
Data Quality and Consistency
Collaboration with Stakeholders
The warning outputs from IWLive Pro can be shown at model, DMA and sensor levels. Therefore this process can identify specific areas that require model maintenance, whether through desktop updates or field testing, and identifies regions within models that require rebuilding. This helps clients maintain their suite of models without the need for regular and expensive rebuilds.
If you would like to learn more about how HydroCo can support you on your real-time modelling and IWLive journey, please contact us at innovation@hydroco.co.uk or call 023 92 450 007.